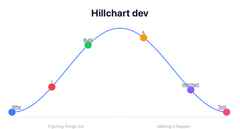
My current team works with Shape Up, so we use hill charts as well. If you have not seen one before: it is a simple way to show where work really stands. Things you are still figuring out climb the left slope, and things you just have to execute roll down the right slope. It captures uncertainty in a way that a percentage bar never does.
So I went looking for a tool to make them. And that is where the trouble started.
Every option had a catch
I tried a handful of existing hill chart tools. Each one had at least one of these problems:
- It was unstable. Dots would not drag properly, charts would not save, or the page would simply break.
- It required a login. I wanted to sketch a quick chart, not create an account and confirm an email first.
- It wanted payment. A subscription to draw a curve with a few dots on it felt like a lot.
None of them let me do the one thing I actually wanted: open a page, place some dots, and share the result.
So I built Hillchart.dev
The goal was deliberately small: a hill chart tool that is simple but works.
- No login. Open it and start.
- No payment. It is free.
- Just the features you need. Add items, drag them along the hill, name them, and share your chart.
That is it. And because it does less, there is less to break.
Why no live sync (yet)
I did think about adding live, multi-user sync so a whole team could move dots together in real time. It is a genuinely nice feature.
But it is also the kind of feature that pulls in accounts, servers, sessions, and a lot of moving parts. That is exactly the complexity that made the other tools frustrating in the first place. Adding it would quietly turn the simple tool into one of the things I was trying to avoid.
So for now I am keeping it out. Simplicity is the feature.
Try it, and tell me what is missing
If you track work in slopes instead of percentages, give Hillchart.dev a try.
And if there is a feature you genuinely need, something that would make it more useful without making it heavier, I would love to hear it. Feel free to request features. I would rather add the few things people actually use than everything I can imagine.